Having home automation is great. Having it reliable and available 24/7 is even better! Especially when you use smart locks, fire sensors alarms and so on.
In this article, I’ll detail how I setup the monitoring of my Home Automation infrastructure using Zabbix. The perfect monitoring is a mix of detection and also alerting.
First of all – you need to identify what are your different components, and what do you want to monitor ? Which layers ?
Bottom-up – it starts with the hardware:
- Switches
- Routers
- Servers
- Appliances
- Gateways (KNX-IP…)
Next, system:
- Virtual Machines
- Operating System
- Containers (Docker)
Software:
- openHAB
Components:
- openHAB binding states
To begin with, I decided to startup with a “Dockerized” Zabbix environment. My stack is very simple:
---
version: "2"
networks:
  zabbix-internal:
    driver: bridge
  web:
    external:
      name: web
services:
  zabbix-mysql:
    image: mysql
    container_name: zabbix-mysql
    networks:
      zabbix-internal:
    environment:
      MYSQL_ROOT_PASSWORD: *********
    volumes:
      - "/srv/iscsi/dockers/zabbix/mysql:/var/lib/mysql"
    restart: unless-stopped
    labels:
      - "traefik.enable=false"
  zabbix-server:
    # Documentation: https://hub.docker.com/r/zabbix/zabbix-server-mysql
    image: zabbix/zabbix-server-mysql
    container_name: zabbix-server
    restart: unless-stopped
    networks:
      zabbix-internal:
    ports:
      - "10051:10051"
    environment:
      TZ: "Europe/Paris"
      DB_SERVER_HOST: "zabbix-mysql"
      MYSQL_USER: "root"
      MYSQL_PASSWORD: "**********"
      ZBX_STARTPINGERS: 5
      ZBX_JAVAGATEWAY: "zabbix-java-gateway"
      ZBX_JAVAGATEWAYPORT: 10052
      ZBX_JAVAGATEWAY_ENABLE: "true"
      ZBX_STARTJAVAPOLLERS: 5
    labels:
      - "traefik.enable=false"
  zabbix-java-gateway:
    image: zabbix/zabbix-java-gateway
    container_name: zabbix-java-gateway
    restart: unless-stopped
    networks:
      zabbix-internal:
    environment:
      TZ: "Europe/Paris"
    labels:
      - "traefik.enable=false"
  zabbix-frontend:
    image: zabbix/zabbix-web-nginx-mysql
    container_name: zabbix-frontend
    restart: unless-stopped
    networks:
      zabbix-internal:
      web:
    environment:
      TZ: "Europe/Paris"
      PHP_TZ: "Europe/Paris"
      DB_SERVER_HOST: "zabbix-mysql"
      MYSQL_USER: "zabbix-frontend"
      MYSQL_PASSWORD: "*****************"
      ZBX_SERVER_HOST: "zabbix-server"
      ZBX_SERVER_NAME: "Ben"
You’ll notice that in addition to a “basic” Zabbix stack, I added Zabbix Java Gateway, to be able to monitor openHAB JVM properly.
The monitoring of hardware is pretty easy and standard: SNMP, or even better, Zabbix Agent ! Most hardware support SNMP (I mean – decent hardware), and most operating system, whatever architecture, avec Zabbix agent packaged in standard package manager they come with. Devices that I monitor using SNMP & Zabbix agents:
- Router (Ubiquiti EdgeRouter)
- Switches (Ubiquiti EdgeSwitch)
- Wireless Access Points (Ubiquiti Unifi NanoHD, InWall HD)
- Linux hosts (VM and physical – including Raspberry, OrangePi…)
- ESXi hypervisor
- Synology NAS (storage + CCTV)
There are devices that you want to monitor but unfortunately don’t provide SNMP. This is for example the case of Apple TV, Sonos devices, and Tasmota devices, which I widely use for their cost and efficiency in my installation. For those device, you have multiple choice:
- monitor that they are alive using traditional ICMP ping
- monitor that the services are up (HTTP for example)
I found that ICMP was sufficient for Apple TV, Sonos and Tasmota devices.
Your monitoring should be driven by your “threats”: what are you scared about ?
In my case, I am scared of being locked down out of my apartment. So I need to be sure that openHAB is working well (Java app -> monitor the JVM), ensure that openHAB is well connected to the various bridges/gateways (bindings), and also ensures that some devices are still reporting alive (zigbee battery devices).
I will not detail the basic steps of creating a HOST and configuring a Zabbix environment, Google is full of that ! I will only focus on specific aspects of openHAB.
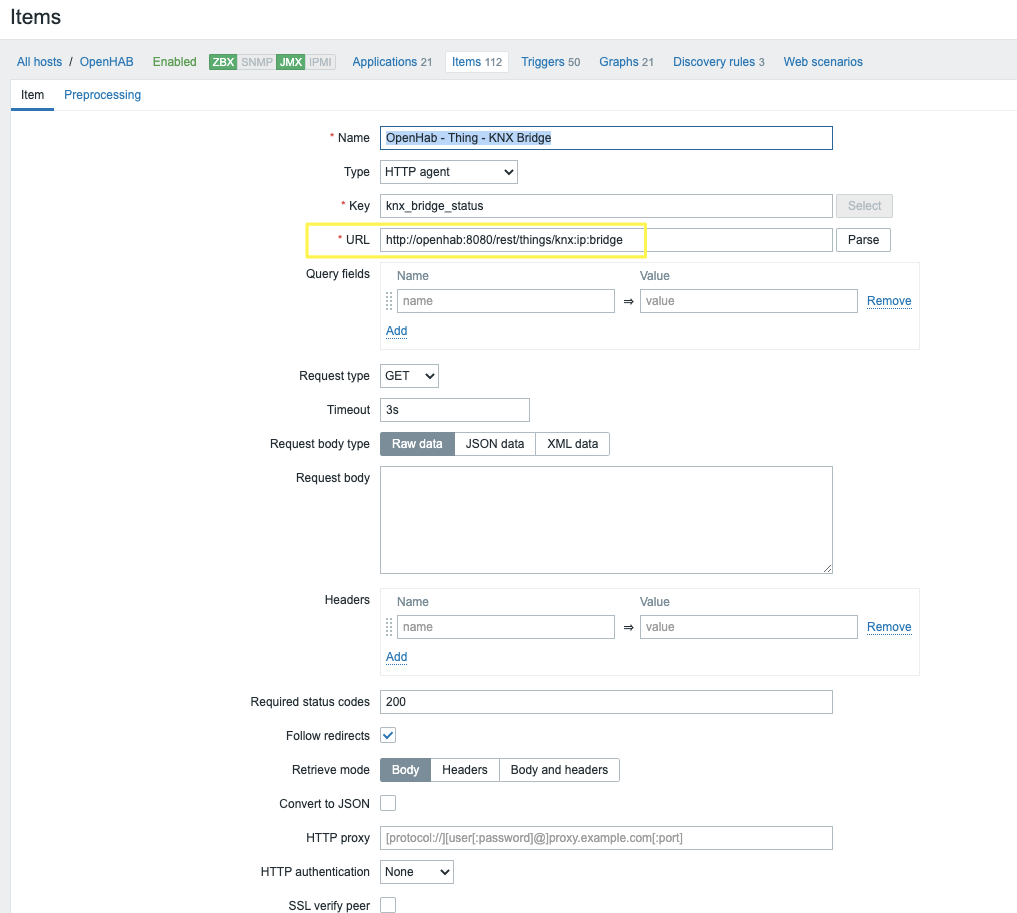
We will be using the openHAB REST API to monitor the inside of openHAB and bindings:

Then:

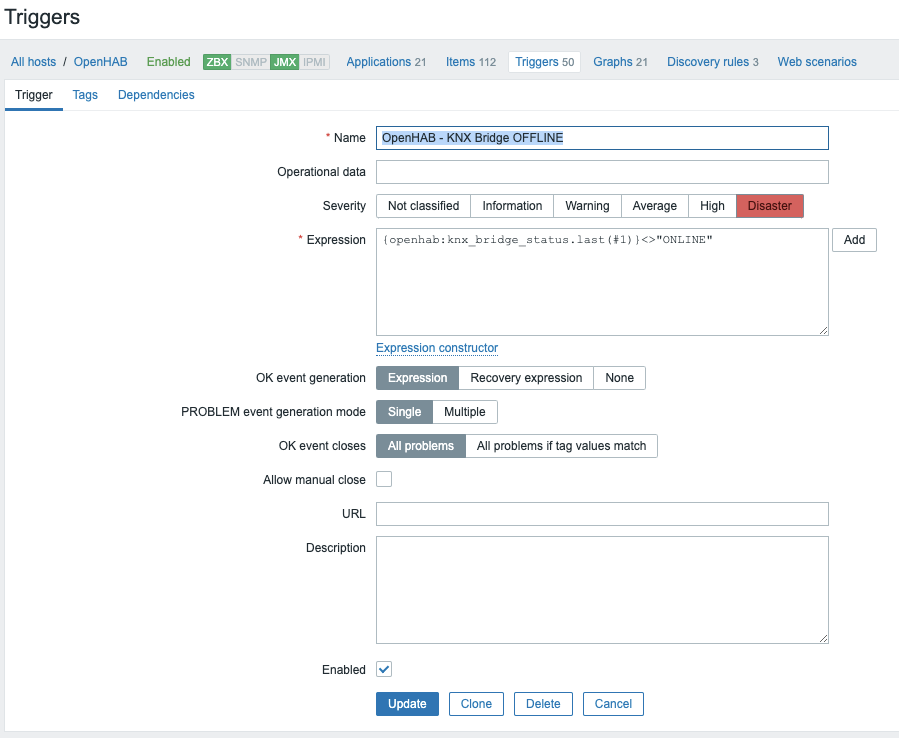
Once you have created your item within a host, just create a trigger:

